Chief Economist Eugenio J. Alemán discusses current economic conditions.
We understand that many economists/analysts/market participants are already discounting inflation as a serious problem for the U.S. economy. Even if this seems correct on the surface, the problem is very different for those who suffer the most from higher prices – middle- and lower-income individuals. Typically, individuals at these income levels are normally not able to shield themselves from higher prices as higher- income individuals are able to do. One of the biggest reasons for this is that lower- and middle-income individuals and households basically spend all their income on necessities, which have seen large increases in prices over the last several years and consequently have very little to nothing left at the end of each month. True, the rate at which these prices are rising is coming down, or what is called the process of disinflation. However, the cumulative effects of the high rate of inflation during the last several years are still very much affecting Americans today, even if many of them have received increases in wages and salaries during the period.
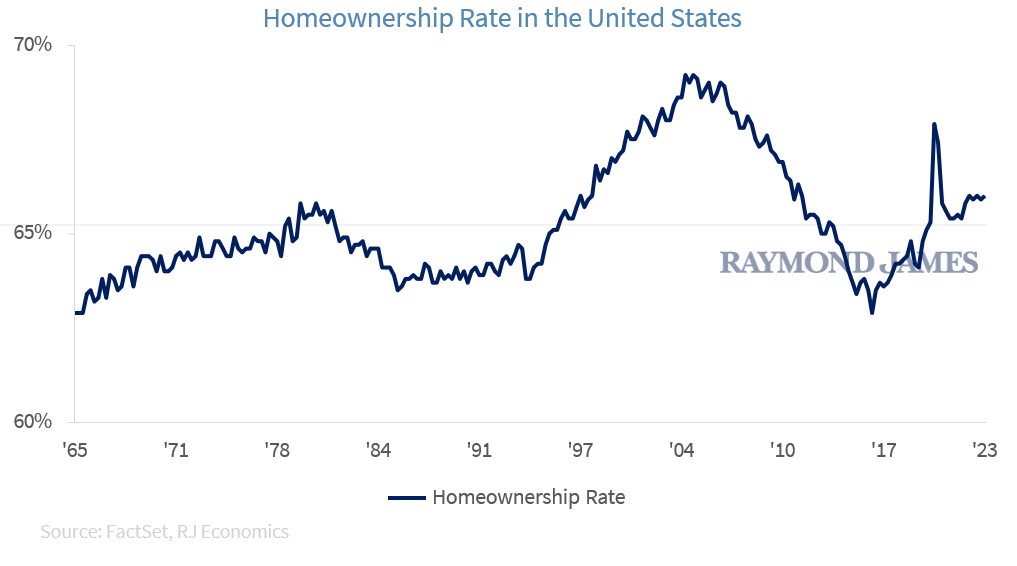
Furthermore, probably a large percentage of Americans in the middle- and low-income levels are renters of their homes, which means that they suffer the higher costs of shelter that have occurred over the last several years. Those that have fixed mortgage rates loans have seen no increase in housing mortgage payments even if shelter costs have been very high. Thus, for high-middle- to high-income Americans, inflation has not been as damaging as it has been for middle- to low-income Americans. Probably the only exception to these higher housing costs, other than renters, are those who are buying a home at higher interest rates today compared to the past. However, those that are buying homes today are typically doing so because they can afford to qualify for higher mortgage rates loans, which is very different than what happened in the buildup to the Great Recession. According to the U.S. Census Bureau, the homeownership rate in the U.S. during the third quarter of this year was 66.0%. This means that about 34% of U.S. households are renters and they are the ones who have suffered from the increase in shelter costs the most during the last couple of years.
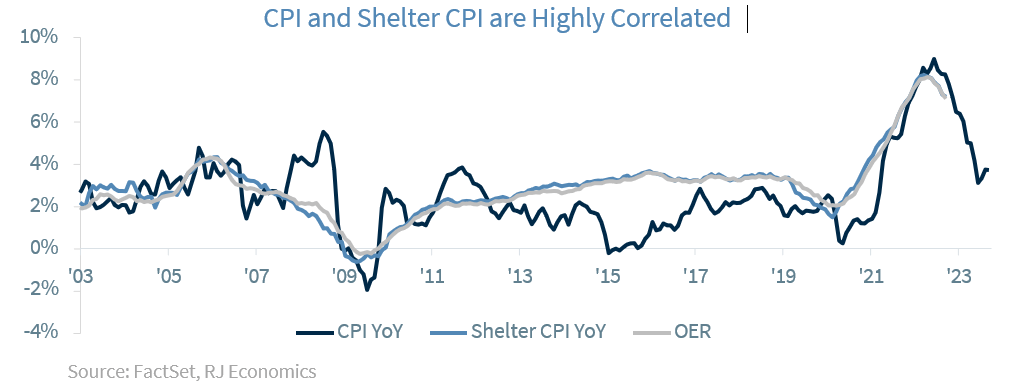
After discussing inflation for over two years, we are all familiar with the fact that shelter costs are by far the largest component of the Consumer Price Index, making up 34.4% of the Index. Shelter includes a variety of items, but over 95% can be attributed to two of them: Rent of Primary Residence and Owners’ Equivalent Rent of Residences (OER). This last one can be simply explained as the rent that one would have to pay to rent the currently owned home, unfurnished and without utilities. OER has had a 98% correlation with the broader shelter CPI over the last 20 years, and therefore for this study, we’ll use OER as a proxy and disregard other items such as household insurance, lodging away from home, among others. As we discussed in previous Weekly Economics, shelter costs are known to be a lagging indicator as tenants tend to sign long-term leases, therefore locking in a certain price for an extended period, regardless of what the housing market does. Overall, if we apply a 12-month lag to shelter, we get a correlation with the overall headline CPI of about 70%, which is what one should expect, as this component alone makes up over one-third of the index.
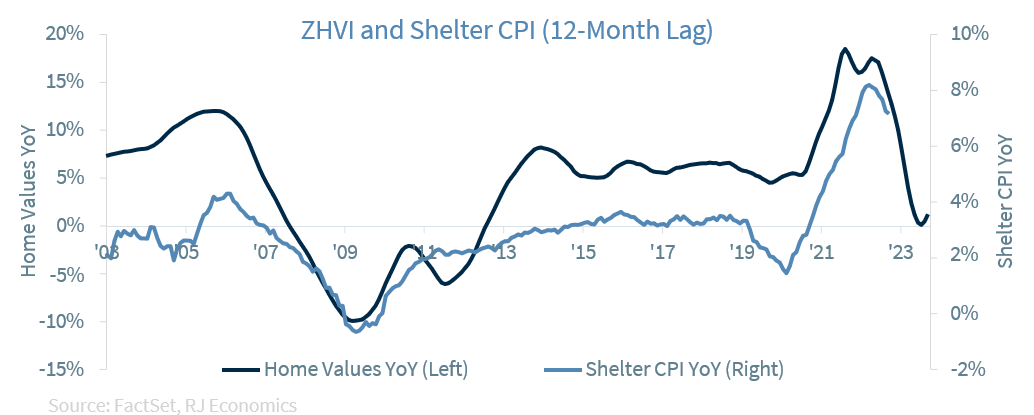
There are a variety of companies that provide us with more timely data about the housing market such as Zillow, Redfin, and Rent.com. Zillow has a data series called Zillow Home Value Index (ZHVI), which measures the value of typical home value and market changes across a given region and housing type. For our study, we will focus on single-family homes, which are the largest group across the country. The chart below confirms that this data series is a good proxy to measure shelter CPI, as it has an 80% correlation with the lagged shelter CPI that we measured in the previous chart.
Since the double-digit YoY growth experienced in 2021 and 2022, home values have stopped growing, but they have barely breached negative territory on a year-over-year basis. This is very important because while the chart shows that the growth of home values has came down considerably in 2022 and 2023, there are signs that it is starting to rise again due to a lack of inventory of homes across the U.S..
During the Great Recession, home values as measured by the ZHVI, declined for five years straight, with the median home value declining by ~31%. Yet, despite a historical housing crash and a deep housing recession, the shelter component of CPI barely declined. In fact, it only experienced a total peak-to-trough decline of less than 1%, and it remained barely in negative territory on a year-over-year basis for 11 consecutive months. In addition to the financial crisis and severe recession, the number of months of supply of existing homes reached more than 11 months. This put further downward pressure on home prices as, on average, homes were sitting on the market for almost one year before being sold, often at much lower prices than the original asking price.
Today’s supply of existing homes is only 3.4 months, and according to building permits and housing starts, this number is unlikely to trend significantly higher in the short term. While we expect a recession in 2024, we continue to believe that it will be very mild. What about if the Federal Reserve (Fed) cuts rates or Treasurys decline, bringing mortgage rates lower? A decline in yields, and thus in mortgage rates could bring many individuals back into the market, ultimately keeping home prices relatively high or at least preventing large declines like in previous cycles. Lastly, from a historical standpoint, shelter costs have grown on average 2.9% YoY over the last twenty years, and with all the tailwinds (or cushions) for home prices mentioned above, it is hard to imagine that we will see a negative contribution to CPI from the shelter component anytime soon. Additionally, home values have started to increase again over the last few months, and if that were to continue, we could see shelter prices increase once again next year.
The bottom line is that while we continue to believe that inflation is decelerating and will continue to slowdown, the shelter component might remain elevated for longer, especially if the Fed were to ease rates sooner than expected. On the other hand, if our expectations are correct and we still have over 5% YoY shelter inflation six months from now, and other components of inflation such as services don’t decline significantly, we believe this would be an additional reason for the Fed to keep rates persistently high as well as higher for longer.
We have made a small change to our federal funds rate forecast and have eliminated our expected December increase in the rate as it was established in the September Federal Reserve dot plot. Thus, we now have an end-of-the-year rate of 5.25%-5.50% rather than 5.50%-5.75%. The fact that inflation is expected to continue its disinflationary process during the last months of the year plus the market’s expectations of a continued pause in December have convinced us that the Fed will stay put in December.
However, we want to stress that it is still not clear that the Fed is done raising interest rates for this tightening cycle, as there are a multitude of unpredictable factors that could influence its efforts and require additional tweaks to monetary policy. However, as it stands today, the Fed is in no rush to continue to increase interest rates and will continue to watch for incoming data to determine the need to change interest rates in the coming months.
Economic and market conditions are subject to change.
Opinions are those of Investment Strategy and not necessarily those of Raymond James and are subject to change without notice. The information has been obtained from sources considered to be reliable, but we do not guarantee that the foregoing material is accurate or complete. There is no assurance any of the trends mentioned will continue or forecasts will occur. Last performance may not be indicative of future results.
Consumer Price Index is a measure of inflation compiled by the US Bureau of Labor Statistics. Currencies investing is generally considered speculative because of the significant potential for investment loss. Their markets are likely to be volatile and there may be sharp price fluctuations even during periods when prices overall are rising.
Consumer Sentiment is a consumer confidence index published monthly by the University of Michigan. The index is normalized to have a value of 100 in the first quarter of 1966. Each month at least 500 telephone interviews are conducted of a contiguous United States sample.
Personal Consumption Expenditures Price Index (PCE): The PCE is a measure of the prices that people living in the United States, or those buying on their behalf, pay for goods and services. The change in the PCE price index is known for capturing inflation (or deflation) across a wide range of consumer expenses and reflecting changes in consumer behavior.
The Consumer Confidence Index (CCI) is a survey, administered by The Conference Board, that measures how optimistic or pessimistic consumers are regarding their expected financial situation. A value above 100 signals a boost in the consumers’ confidence towards the future economic situation, as a consequence of which they are less prone to save, and more inclined to consume. The opposite applies to values under 100.
Certified Financial Planner Board of Standards Inc. owns the certification marks CFP®, CERTIFIED FINANCIAL PLANNER™, CFP® (with plaque design) and CFP® (with flame design) in the U.S., which it awards to individuals who successfully complete CFP Board's initial and ongoing certification requirements.
Links are being provided for information purposes only. Raymond James is not affiliated with and does not endorse, authorize or sponsor any of the listed websites or their respective sponsors. Raymond James is not responsible for the content of any website or the collection or use of information regarding any website's users and/or members.
GDP Price Index: A measure of inflation in the prices of goods and services produced in the United States. The gross domestic product price index includes the prices of U.S. goods and services exported to other countries. The prices that Americans pay for imports aren't part of this index.
The Conference Board Leading Economic Index: Intended to forecast future economic activity, it is calculated from the values of ten key variables.
The Conference Board Coincident Economic Index: An index published by the Conference Board that provides a broad-based measurement of current economic conditions.
The Conference Board lagging Economic Index: an index published monthly by the Conference Board, used to confirm and assess the direction of the economy's movements over recent months.
The U.S. Dollar Index is an index of the value of the United States dollar relative to a basket of foreign currencies, often referred to as a basket of U.S. trade partners' currencies. The Index goes up when the U.S. dollar gains "strength" when compared to other currencies.
The FHFA House Price Index (FHFA HPI®) is a comprehensive collection of public, freely available house price indexes that measure changes in single-family home values based on data from all 50 states and over 400 American cities that extend back to the mid-1970s.
Import Price Index: The import price index measure price changes in goods or services purchased from abroad by U.S. residents (imports) and sold to foreign buyers (exports). The indexes are updated once a month by the Bureau of Labor Statistics (BLS) International Price Program (IPP).
ISM New Orders Index: ISM New Order Index shows the number of new orders from customers of manufacturing firms reported by survey respondents compared to the previous month. ISM Employment Index: The ISM Manufacturing Employment Index is a component of the Manufacturing Purchasing Managers Index and reflects employment changes from industrial companies.
ISM Inventories Index: The ISM manufacturing index is a composite index that gives equal weighting to new orders, production, employment, supplier deliveries, and inventories.
ISM Production Index: The ISM manufacturing index or PMI measures the change in production levels across the U.S. economy from month to month.
ISM Services PMI Index: The Institute of Supply Management (ISM) Non-Manufacturing Purchasing Managers' Index (PMI) (also known as the ISM Services PMI) report on Business, a composite index is calculated as an indicator of the overall economic condition for the non-manufacturing sector.
Consumer Price Index (CPI) A consumer price index is a price index, the price of a weighted average market basket of consumer goods and services purchased by households. Changes in measured CPI track changes in prices over time.
Producer Price Index: A producer price index (PPI) is a price index that measures the average changes in prices received by domestic producers for their output.
Industrial production: Industrial production is a measure of output of the industrial sector of the economy. The industrial sector includes manufacturing, mining, and utilities. Although these sectors contribute only a small portion of gross domestic product, they are highly sensitive to interest rates and consumer demand.
The NAHB/Wells Fargo Housing Opportunity Index (HOI) for a given area is defined as the share of homes sold in that area that would have been affordable to a family earning the local median income, based on standard mortgage underwriting criteria.
The S&P CoreLogic Case-Shiller U.S. National Home Price NSA Index measures the change in the value of the U.S. residential housing market by tracking the purchase prices of single-family homes.
The S&P CoreLogic Case-Shiller 20-City Composite Home Price NSA Index seeks to measures the value of residential real estate in 20 major U.S. metropolitan.
Source: FactSet, data as of 7/7/2023