Chief Economist Eugenio J. Alemán discusses current economic conditions.
Markets are convinced that the Federal Reserve (Fed) is going to pause its interest rate campaign after it finalizes its Federal Open Market Committee (FOMC) meeting on Wednesday, September 20. While markets are trying to guess what the Fed is going to do, they are not the ones that conduct monetary policy. Monetary policy is the realm of the Fed, which is the country’s central bank.
However, we agree that many times, the Fed does what the market is expecting it to do and, today, markets are expecting the Fed to stay put or pause in September. However, unless Fed officials change their minds regarding interest rates when they release the new dot-plot on Wednesday, even if they pause in September, we should expect the Fed to increase interest rates once more before the end of this year.
But before speculating what the Fed is going to do next week and the information contained in the Summary of Economic Projections (SEP) and the ensuing dot plot, let’s backtrack to June’s FOMC decision to pause, which was followed by an even more startling decision to increase rates once again in July. Why were we startled by these decisions? First of all, because we asked this question: Why did you pause if you were going to increase rates again in July? There wasn’t a ton of new information in July to prompt a move. Second, the rate of inflation for June, which Fed officials had access to when they convened for the July FOMC meeting, was very benign, with both the headline Consumer Price Index (CPI) as well as the core CPI printing a 0.2% monthly rate. Furthermore, both the headline CPI and the core CPI were still coming down on a year earlier basis.
However, today, oil and gasoline prices are putting pressure on headline CPI and that measure has increased for two consecutive months on a year earlier basis, from a ‘low’ of 3.0% in June to 3.2% in July, to now 3.7% in August, not very comforting if you ask us, in terms of monetary policy effectiveness. True, core CPI has continued to come down on a year-over-year basis, and that is very good news for the Fed. However, that rate was still elevated, at 4.3% in August, with services prices increasing more than expected during the month.
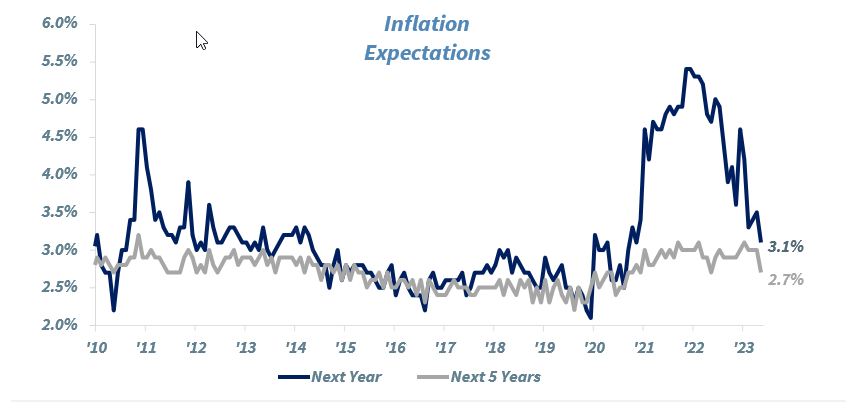
Furthermore, with oil and gasoline prices increasing and expected to continue to increase during the rest of this year and with inflation still above the Fed’s target, the risks for inflation to start to move higher once again, or at least for the disinflationary process to moderate, due to the still strong pace of economic activity should be unsettling for monetary policymakers. At the same time, the Fed has been very lucky, so far, that inflation expectations have increased but have not been unanchored (see chart on previous page). However, nobody knows how long expectations, but especially long-term inflation expectations are going to remain contained. And they should not risk trying to get an answer on that question.
This is especially true because the Fed, according to many, has been partially to blame, perhaps a bit unfairly, for being asleep at the wheel when this inflationary process was set in motion. It will not risk being blamed again if inflation starts moving up again.
It is true that monetary policy takes a relatively long time to affect the economy, that is, it works with a lag that has normally been estimated to be between six and twelve months, and it could use this argument to remain on the sidelines for now. Furthermore, it could be argued that the lag on the economy’s response to monetary policy may have been delayed further due to the fiscal stimulus being delivered by three government bills: the CHIPS Act, the IRA, and the Infrastructure Bill (See our “Weekly Economics: Thoughts of the Week” for September 1, 2023).
Whatever the arguments Fed officials may use for deciding the path of monetary policy going forward, the market’s bet that it will pause, which was at 97% on September 15, 2023, seems to be a risky simplification given the difficult tasks ahead for the Fed. We know that markets prefer certainty to uncertainty, but policymakers’ decision during the September meeting of the FOMC is not as clear cut as markets anticipate, even if, in the end, they end up being correct.
Economic and market conditions are subject to change.
Opinions are those of Investment Strategy and not necessarily those of Raymond James and are subject to change without notice. The information has been obtained from sources considered to be reliable, but we do not guarantee that the foregoing material is accurate or complete. There is no assurance any of the trends mentioned will continue or forecasts will occur. Last performance may not be indicative of future results.
Consumer Price Index is a measure of inflation compiled by the US Bureau of Labor Statistics. Currencies investing is generally considered speculative because of the significant potential for investment loss. Their markets are likely to be volatile and there may be sharp price fluctuations even during periods when prices overall are rising.
Consumer Sentiment is a consumer confidence index published monthly by the University of Michigan. The index is normalized to have a value of 100 in the first quarter of 1966. Each month at least 500 telephone interviews are conducted of a contiguous United States sample.
Personal Consumption Expenditures Price Index (PCE): The PCE is a measure of the prices that people living in the United States, or those buying on their behalf, pay for goods and services. The change in the PCE price index is known for capturing inflation (or deflation) across a wide range of consumer expenses and reflecting changes in consumer behavior.
The Consumer Confidence Index (CCI) is a survey, administered by The Conference Board, that measures how optimistic or pessimistic consumers are regarding their expected financial situation. A value above 100 signals a boost in the consumers’ confidence towards the future economic situation, as a consequence of which they are less prone to save, and more inclined to consume. The opposite applies to values under 100.
Certified Financial Planner Board of Standards Inc. owns the certification marks CFP®, CERTIFIED FINANCIAL PLANNER™, CFP® (with plaque design) and CFP® (with flame design) in the U.S., which it awards to individuals who successfully complete CFP Board's initial and ongoing certification requirements.
Links are being provided for information purposes only. Raymond James is not affiliated with and does not endorse, authorize or sponsor any of the listed websites or their respective sponsors. Raymond James is not responsible for the content of any website or the collection or use of information regarding any website's users and/or members.
GDP Price Index: A measure of inflation in the prices of goods and services produced in the United States. The gross domestic product price index includes the prices of U.S. goods and services exported to other countries. The prices that Americans pay for imports aren't part of this index.
The Conference Board Leading Economic Index: Intended to forecast future economic activity, it is calculated from the values of ten key variables.
The Conference Board Coincident Economic Index: An index published by the Conference Board that provides a broad-based measurement of current economic conditions.
The Conference Board lagging Economic Index: an index published monthly by the Conference Board, used to confirm and assess the direction of the economy's movements over recent months.
The U.S. Dollar Index is an index of the value of the United States dollar relative to a basket of foreign currencies, often referred to as a basket of U.S. trade partners' currencies. The Index goes up when the U.S. dollar gains "strength" when compared to other currencies.
The FHFA House Price Index (FHFA HPI®) is a comprehensive collection of public, freely available house price indexes that measure changes in single-family home values based on data from all 50 states and over 400 American cities that extend back to the mid-1970s.
Import Price Index: The import price index measure price changes in goods or services purchased from abroad by U.S. residents (imports) and sold to foreign buyers (exports). The indexes are updated once a month by the Bureau of Labor Statistics (BLS) International Price Program (IPP).
ISM New Orders Index: ISM New Order Index shows the number of new orders from customers of manufacturing firms reported by survey respondents compared to the previous month. ISM Employment Index: The ISM Manufacturing Employment Index is a component of the Manufacturing Purchasing Managers Index and reflects employment changes from industrial companies.
ISM Inventories Index: The ISM manufacturing index is a composite index that gives equal weighting to new orders, production, employment, supplier deliveries, and inventories.
ISM Production Index: The ISM manufacturing index or PMI measures the change in production levels across the U.S. economy from month to month.
ISM Services PMI Index: The Institute of Supply Management (ISM) Non-Manufacturing Purchasing Managers' Index (PMI) (also known as the ISM Services PMI) report on Business, a composite index is calculated as an indicator of the overall economic condition for the non-manufacturing sector.
Consumer Price Index (CPI) A consumer price index is a price index, the price of a weighted average market basket of consumer goods and services purchased by households. Changes in measured CPI track changes in prices over time.
Producer Price Index: A producer price index (PPI) is a price index that measures the average changes in prices received by domestic producers for their output.
Industrial production: Industrial production is a measure of output of the industrial sector of the economy. The industrial sector includes manufacturing, mining, and utilities. Although these sectors contribute only a small portion of gross domestic product, they are highly sensitive to interest rates and consumer demand.
The NAHB/Wells Fargo Housing Opportunity Index (HOI) for a given area is defined as the share of homes sold in that area that would have been affordable to a family earning the local median income, based on standard mortgage underwriting criteria.
The S&P CoreLogic Case-Shiller U.S. National Home Price NSA Index measures the change in the value of the U.S. residential housing market by tracking the purchase prices of single-family homes.
The S&P CoreLogic Case-Shiller 20-City Composite Home Price NSA Index seeks to measures the value of residential real estate in 20 major U.S. metropolitan.
Source: FactSet, data as of 7/7/2023